How to Measure Training ROI: 4 Numbers Your CFO Cares About
Most training ROI frameworks are over-engineered for the certainty the data can actually support. Here's the practical version.


How to Measure the ROI of Your Training Programs: A Practical Framework
Every L&D leader I talk to has been asked some version of "what's the ROI of this training program?" Most have a complicated answer. Most of those answers don't actually convince the CFO.
Here's the honest reality: measuring training ROI is hard. Not because the math is complicated — it isn't — but because the connection between "we ran a training" and "the business outcome improved" runs through too many uncontrolled variables. A compliance refresh doesn't directly produce revenue. A sales training boosts numbers, but so does the new pricing tier, the seasonal demand cycle, and the rep who finally left.
That doesn't mean ROI is unmeasurable. It means most of the frameworks the L&D industry uses are over-engineered for the level of certainty the data can actually support. After fifteen years of building learning platforms and running training programs, here's the practical framework I'd recommend — drawn from a session corporate learning consultant Miguel Reynoso ran in our L&D Happy Space community, expanded with what's held up in real-world use since.
This article walks through the framework, the four numbers that actually matter, a simple ROI calculator template, and the cases where ROI metrics will mislead you if you're not careful.
Why training ROI is so hard to measure (and why most articles dodge this)
If you google "how to measure training ROI" you'll get a hundred articles citing the Kirkpatrick model — four levels of evaluation: reaction, learning, behavior, results. It's the dominant framework in L&D textbooks, and most articles stop there.
Here's what most of those articles don't say: Kirkpatrick levels 1 and 2 (did learners enjoy the training, did they pass the quiz) are easy and almost meaningless. Levels 3 and 4 (did behavior change, did business outcomes improve) are hard and almost never measured rigorously. The framework is correct in principle and useless in practice for most L&D teams.
The problem is that level 4 — actual business impact — requires a controlled comparison. You'd need a group that did the training and a group that didn't, holding all other variables constant. Most companies can't do this. They can't withhold compliance training from half the workforce, they can't run a quarterly product training as an A/B test, and even when they try, the sample sizes are too small for statistical confidence.
So the honest answer is: you can't measure training ROI to a research-paper standard. What you can do is measure it well enough to defend the budget, allocate resources sensibly, and improve over time. That's a different bar, and the rest of this article is about how to hit it.
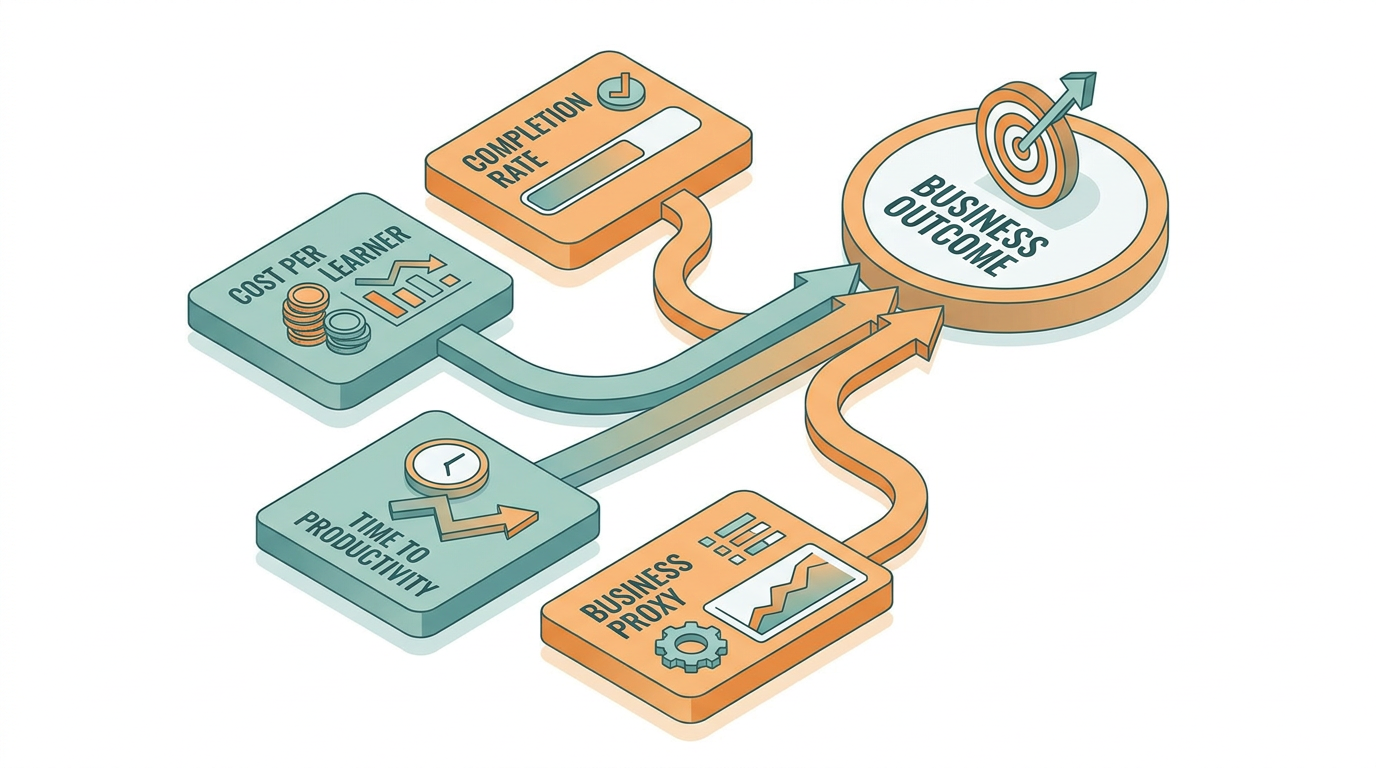
The honest version of training ROI: four numbers that matter
Strip the complexity away. Here are the four numbers that earn you a serious conversation with your CFO.
1. Cost per learner per program. Total cost of the training (development time, license fees, content, instructor hours, prorated) divided by the number of learners. This is your unit cost. Track it over time. If it goes up, you should be able to explain why.
2. Completion rate. The percentage of assigned learners who finished. This is the easiest number to measure and the one most directly under your control. Below 60% on mandatory training is a system problem — assignment process, content quality, or reminder cadence. Below 30% on voluntary content is normal.
3. Time to productivity (for onboarding). Days from start date until the new hire is performing at expected output. Hard to measure precisely but possible to bracket — ask managers at 30, 60, 90 days. If your onboarding program shortens this by even five days, the ROI math gets compelling fast.
4. The business proxy. This is the number that actually matters to your CFO. For sales training: deal close rate or average deal size. For customer service training: CSAT scores or ticket resolution time. For compliance: audit failure rate or incident rate. You won't get a clean before-and-after, but a directional trend across multiple training cohorts is enough.
The L&D teams that get budget increases are the ones that can speak in those four numbers. The ones that don't are usually presenting Kirkpatrick level 1 satisfaction scores, which tells executives nothing about whether the training was worth running.
The five-step framework: from training expense to business partner
Miguel Reynoso, founder of Steel Vision Consulting and a regular contributor to our L&D Happy Space community, runs corporate learning teams through a five-step framework that has held up well in practice. I'm reproducing it here because it gives you something concrete to follow rather than abstract principles.
Step 1 — Optimization. Before running any training, do audience analysis and evaluate the delivery modality. A 4-hour instructor-led workshop, a self-paced 30-minute course, and a 2-minute microlearning nudge are three completely different cost structures with different effectiveness profiles. Decide modality, duration, and intended outcomes first — then estimate costs and potential return. Most L&D teams skip this step and default to whatever modality their LMS makes easiest, which is usually the wrong answer.
Step 2 — Alignment. Identify the company's fiscal goals — revenue growth, cost reduction, audit compliance, retention — and map every training recommendation to one of them. This is the single highest-leverage step for changing how L&D is perceived internally. When you can say "this training maps to the customer retention goal the CFO mentioned last quarter," you're a business partner, not a cost center.
Step 3 — Congruence. Use a structured method (Bloom's Taxonomy, the KSA model — Knowledge, Skills, Abilities — or an AI course outline tool) to draft learning outcomes that connect directly to business goals. Prototype, share with stakeholders, get buy-in before you build. Most training failures are alignment failures dressed up as content failures.
"Leveraging an AI Course Builder streamlines the process of creating learning outcomes aligned with business objectives, saving countless hours and ensuring training programs are focused on driving real impact." — Miguel Reynoso, Founder, Steel Vision Consulting
Step 4 — Measurement. Don't wait until the training ends to think about measurement. Decide the four numbers (above) before you build the program, and design the tracking into the program itself. Integrate training KPIs into quarterly business reviews so executives see them. Highlight named employee success stories where the connection between training and outcome is concrete. This is also where scaling corporate training without sacrificing quality gets interesting — programs that measure well are programs that scale predictably.
Step 5 — Evaluation. Run feedback loops after the program. Not generic satisfaction surveys — specific structured feedback on what worked, what didn't, what's missing. Encourage learners to maintain portfolios or case examples that document their application of the training. Use the feedback to refine the next cohort, then the one after that.
The framework isn't magic. What makes it work is that each step forces an explicit decision — modality, business goal, learning outcome, measurement plan, feedback loop — instead of letting those decisions get made implicitly by whoever happens to own the LMS.
Want help applying this framework to your training programs? Book a 30-minute call and we'll walk through your specific situation. No pitch — just a working session on whichever step you're stuck on.
A simple ROI calculator template
Here's the math, with an example. Adapt the numbers to your situation.
Inputs
- Total program cost: €15,000 (development + licensing + instructor time + admin)
- Learners enrolled: 100
- Average loaded salary cost per learner: €45/hour
- Hours of training time per learner: 4
- Expected productivity gain per learner per year: 2%
- Average annual loaded salary: €70,000
Cost side
- Direct program cost: €15,000
- Opportunity cost (learner time): 100 × 4 × €45 = €18,000
- Total cost: €33,000
Benefit side
- Productivity gain per learner: 2% × €70,000 = €1,400/year
- Total benefit (year 1): 100 × €1,400 = €140,000
ROI calculation
- Net benefit: €140,000 − €33,000 = €107,000
- ROI: €107,000 / €33,000 = 324%
If those numbers sound too good — they often do — the place to push back is the productivity gain assumption. Two percent is a conservative number for well-designed onboarding training; it's wildly optimistic for a one-off compliance refresh. Always sensitivity-test the assumption that does the most work in the calculation, and present a range (low estimate, expected, high estimate) rather than a single point.
This is also why time-to-productivity numbers are so valuable. They turn "productivity gain" from a guess into something the business can actually track. If a new sales rep takes 90 days to reach quota without training and 75 days with training, the math gets concrete fast.
When ROI metrics mislead — and what to do instead
Three failure modes are worth flagging because they're common and damaging.
Failure mode one: optimizing for what's easy to measure. Completion rates are easy. Satisfaction scores are easy. But high completion of bad training isn't a win — it's a waste of everyone's time at scale. The L&D teams thriving are the ones that report cost per learner and business proxy metrics, even when the numbers are uncomfortable, because the conversations those numbers spark are the conversations that improve the program.
Failure mode two: claiming credit you can't defend. If sales numbers go up after a sales training, the worst thing you can do is take credit for the whole increase. The CFO will ask one question — "how do you know it wasn't the new pricing?" — and your credibility takes a hit you'll spend a year recovering from. Be the L&D leader who says "training contributed; here's the part I'm confident about and here's the part I'm not."
Failure mode three: measuring training as if it's the only intervention. Most business outcomes are driven by multiple inputs — training, process, tooling, hiring, incentives. Training is one lever among many. The realistic claim isn't "training caused the improvement," it's "training was a necessary condition for the improvement, alongside these other levers." That's an honest statement that holds up under scrutiny.
The L&D function that wins long-term is the one that gets the credibility right. Underclaiming and over-delivering builds trust. Overclaiming and under-delivering kills it.
What this looks like in a small or growing company
Most of this article applies whether you're a 50-person company or a 5,000-person company, but the time investment scales. A small L&D team — or a single L&D specialist, which is more common — should pick the two or three numbers that matter most for their specific context and ignore the rest.
For a growing company shopping for an LMS, the practical move is: choose a platform that surfaces the four core numbers (cost per learner, completion rate, time to productivity, and at least one business proxy) without requiring you to build dashboards from scratch. That's not a feature most L&D vendors lead with, but it's the one that determines whether you'll actually measure anything six months after launch. If you're at that stage of the buying process, Best LMS for Small Business in 2026 is a useful next read.
For a company already running training and trying to prove value, start with the cost-per-learner number and one business proxy. You can build to the full framework over a year. You can't build to it in a week, and trying will burn you out.
Want to see how Workademy surfaces these numbers in a single dashboard — without requiring you to assemble them from five tools? Book a 30-minute intro call and I'll walk through it on your specific use case.
The honest version of training ROI is: it's measurable enough to defend a budget, improve programs, and earn a seat at the strategic conversation — but not measurable to a research standard, and any framework that promises otherwise is overselling. Build the practice around the four numbers that matter, the five steps that force good decisions, and the credibility of underclaiming what you can't prove.
That's not the most dramatic answer to "what's the ROI of training?" — but it's the one that holds up.
The full L&D Happy Space session with Miguel Reynoso is here on YouTube if you want the original conversation.
Olga Filipova is the founder of Workademy, an AI-powered LMS for growing teams, and the author of "Learning Vue.js 2" (Packt Publishing). She has 15+ years of experience in software engineering and EdTech. This article was originally co-authored with Kateryna Tur as a summary of L&D Happy Space session #19 with Miguel Reynoso, and substantially expanded in 2026.